Where is Bridge the Gap Fund money going? Which schools are participating? How many students experiences are taking shape?
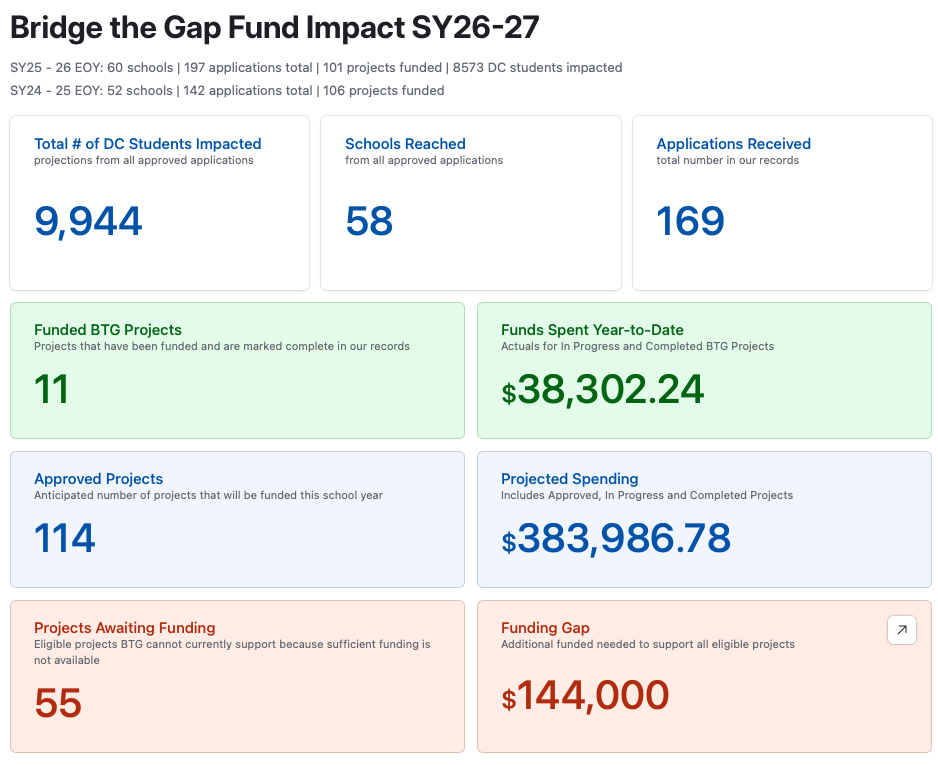
Our public BTG dashboard offers a regularly updated view of that work, including the schools reached, projects moving forward, and funding supporting student experiences.
Transparency is part of how Live It Learn It stewards the Fund. We want educators, policymakers, and the community to see how resources are being used and whom they are reaching.
Explore the Bridge the Gap Fund Dashboard →
See how BTG funding is distributed across wards and school need categories, explore participation across DCPS and public charter schools, and follow project activity throughout the year.
The dashboard updates as our team processes applications and records spending. As you explore, keep in mind that projected spending includes allocations for all approved BTG projects. Spending to date reflects expenses already recorded, so it does not show the full amount needed for projects moving forward. Student totals represent projected participation across projects, so a student may be counted in more than one experience.
We’ll continue sharing project stories and updates on funding availability. Thank you to the educators, partners, and supporters working alongside us to make these experiences possible.